Advanced Multi Dimensional Operational Environment Visualization and Screening System
Revolutionize big data: Creating immersive data visualizations has become fast and easy! Create data dashboard products in minutes with a new zero-code constructor!
Introduction
Importance of data visualization
Understanding complex datasets can be challenging, but data visualization provides a powerful solution to transform large amounts of raw data into visual representations, which are easier to comprehend and analyze. These visualizations highlight patterns, trends, and relationships that might be hidden in the raw data, enabling quicker and more insightful decision-making.
Challenges of traditional 2D visualization
In many cases, 2D visualizations struggle to convey the full richness and complexity of the data, leading to oversimplification or loss of important information. Additionally, overcrowding and clutter can occur when trying to visualize large datasets in a 2D space, making it hard to discern individual data points or patterns.
Advantages of 3D
3D provides a more immersive and interactive experience, allowing users to explore data from multiple perspectives and angles. This depth perception enhances understanding by enabling users to perceive spatial relationships more intuitively, especially in datasets with complex structures or multidimensional attributes.
The need for white label solutions
On demand
Businesses increasingly seek tailored software that aligns precisely with their unique needs and workflows. Customization offers flexibility, scalability, and efficiency, empowering users to optimize their operations and drive innovation.
Benefits
White label solutions offer businesses the opportunity to brand products with their own identity without the need for extensive development resources. We are constantly developing and updating the product in an automated way: no need to download software - everything is available from our cloud platform.
Solution
Customizable branding to align with clients unique identities
API to embed the visualizations to any of your apps for desktop & mobile apps
AR/VR support is actively developed for further engagement of the users
Enhanced data understanding through immersive 3D visualization and easy to use dashboard constructor. Setup the data slices easily for your visualizations in a few clicks
Scalability to handle large datasets with visualizations that adapt to any amount of data in real time
Streamlined decision-making with real-time data insights gives you the opportunity to react faster and more accurately in a rapidly changing world of information
Financial analytics and risk management systems
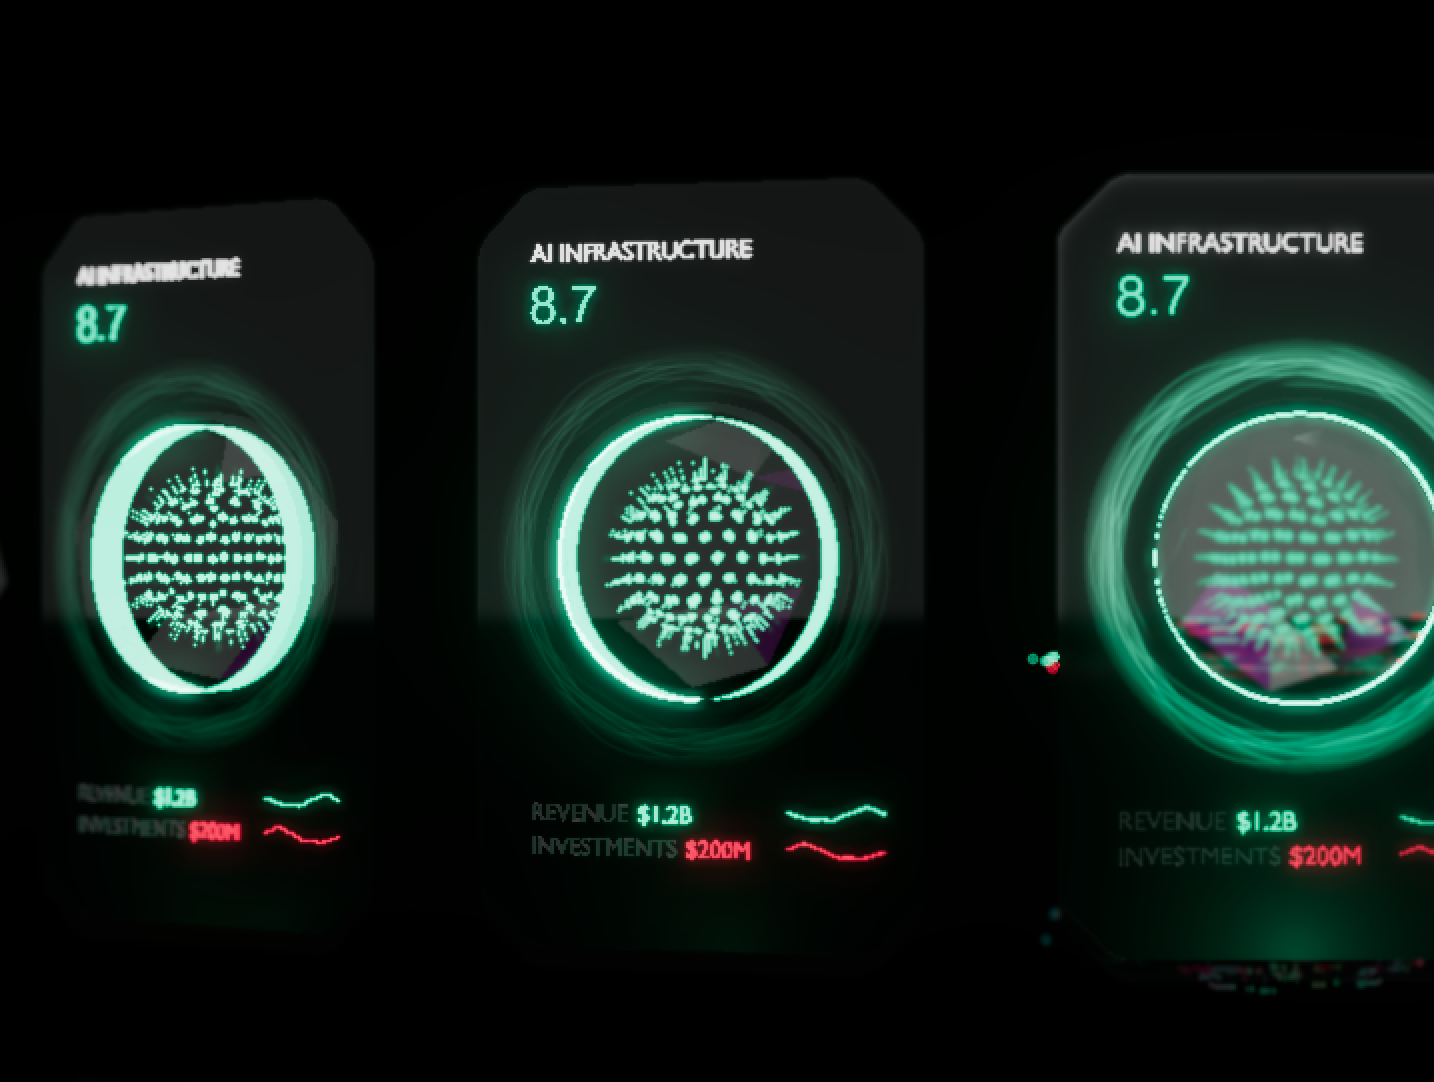
Use charts with thousands of companies divided into categories, grouped by the most important financial indicators, presented on one screen in a convenient way.
Healthcare data visualization for medical research and patient care
Dozens of filters make it easy to screen for and highlight datapoints

Manufacturing and supply chain optimization
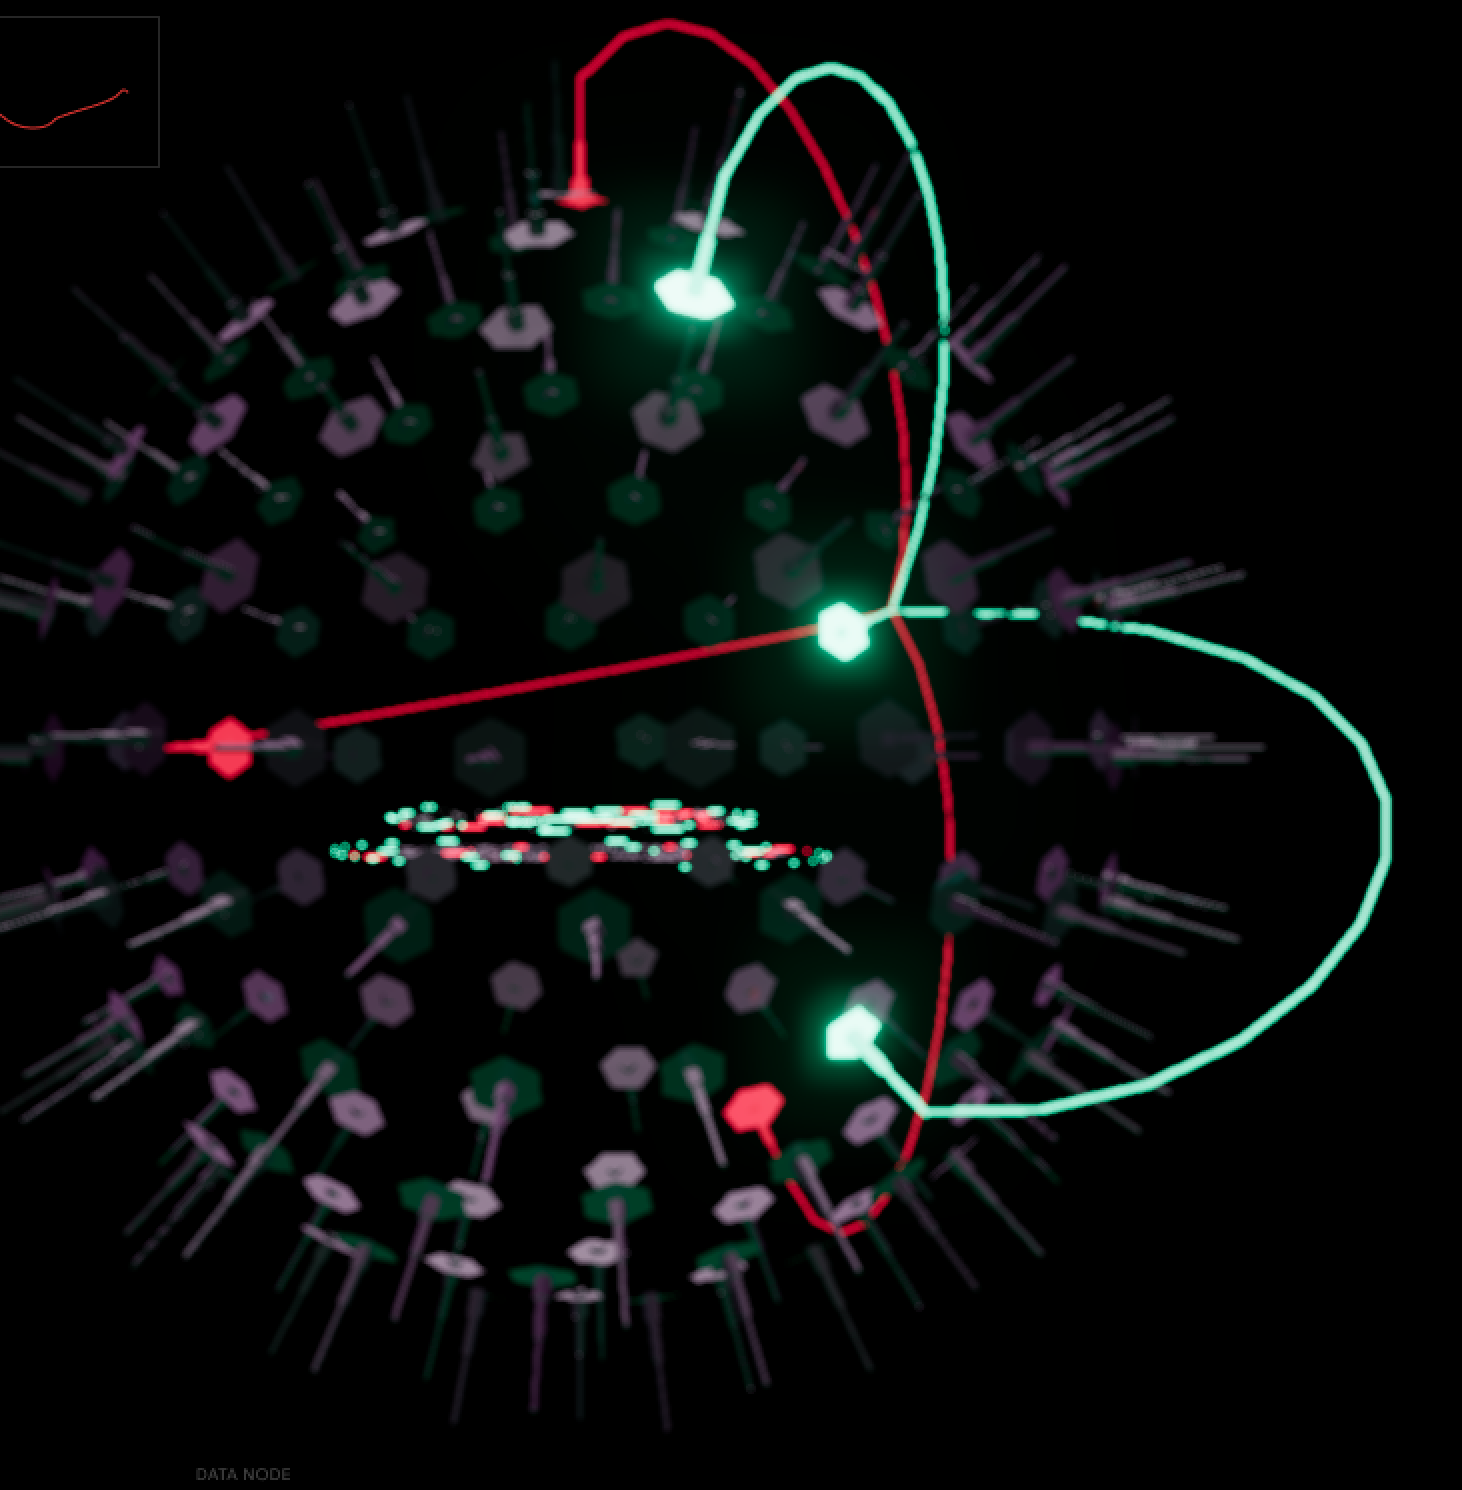
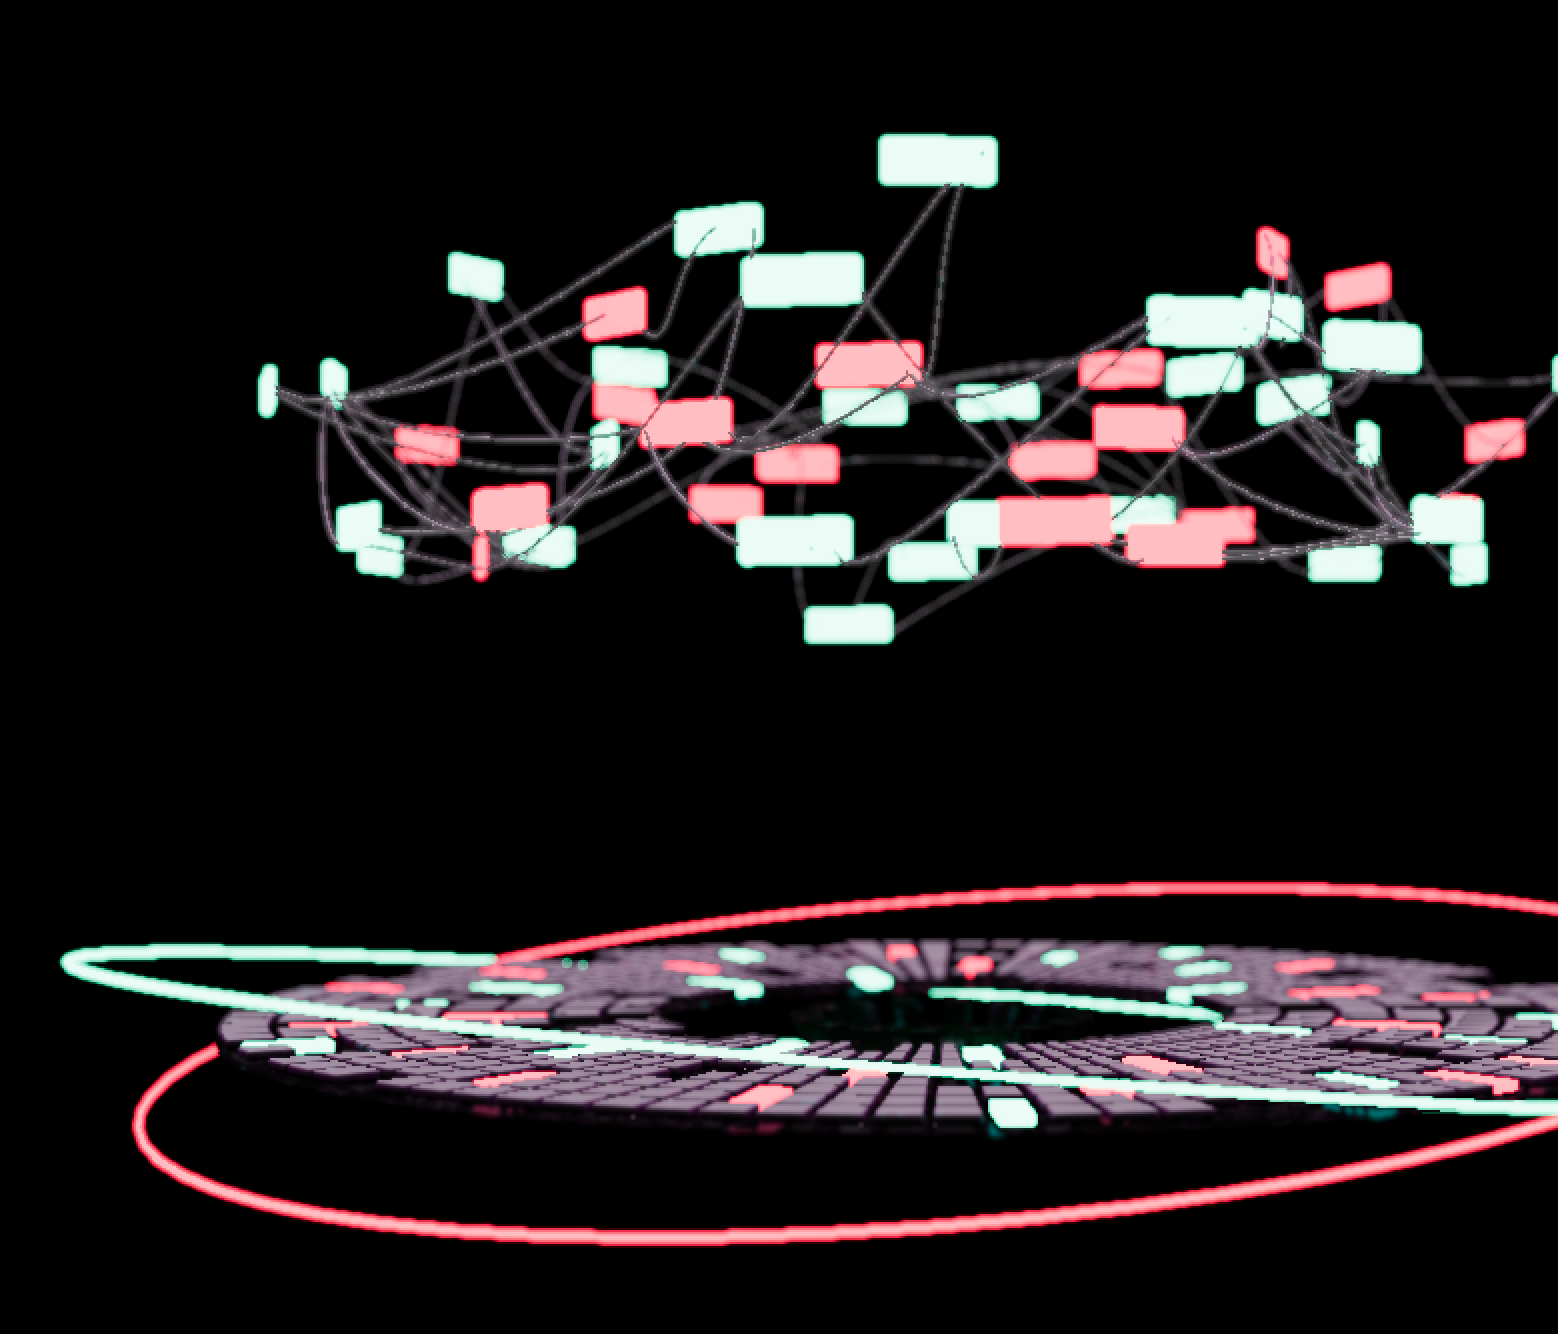
The complex relationships between different components are now easy to track in our new tool “node connections”. This provides an intuitive representation of complex N-to-N relationships between datapoints, such as investor / investment relations.
Marketing and consumer behavior analysis
Explore trends, patterns, and correlations, enhancing insights into consumer preferences.
